Going Further with Feluda
You have completed the core setup: a configured AI provider, secrets stored safely, flows built and running, and Genes installed. This final guide covers the advanced features that turn Feluda into a full automation platform.
📓 Journal
A Markdown log that AI agents write to during execution. Monitor what your workflows did, add manual notes, and track results over time.
🔌 MCP Servers
Connect external tool servers using the Model Context Protocol. Extend Feluda with custom APIs, internal services, or community tools.
⏰ Schedule Manager
Automate recurring flows — daily reports, weekly scans, monthly audits. Set it and forget it.
🔍 Debugging
Inspect every tool call, input/output, and error in the Activity log. Use Emit blocks for intermediate output.
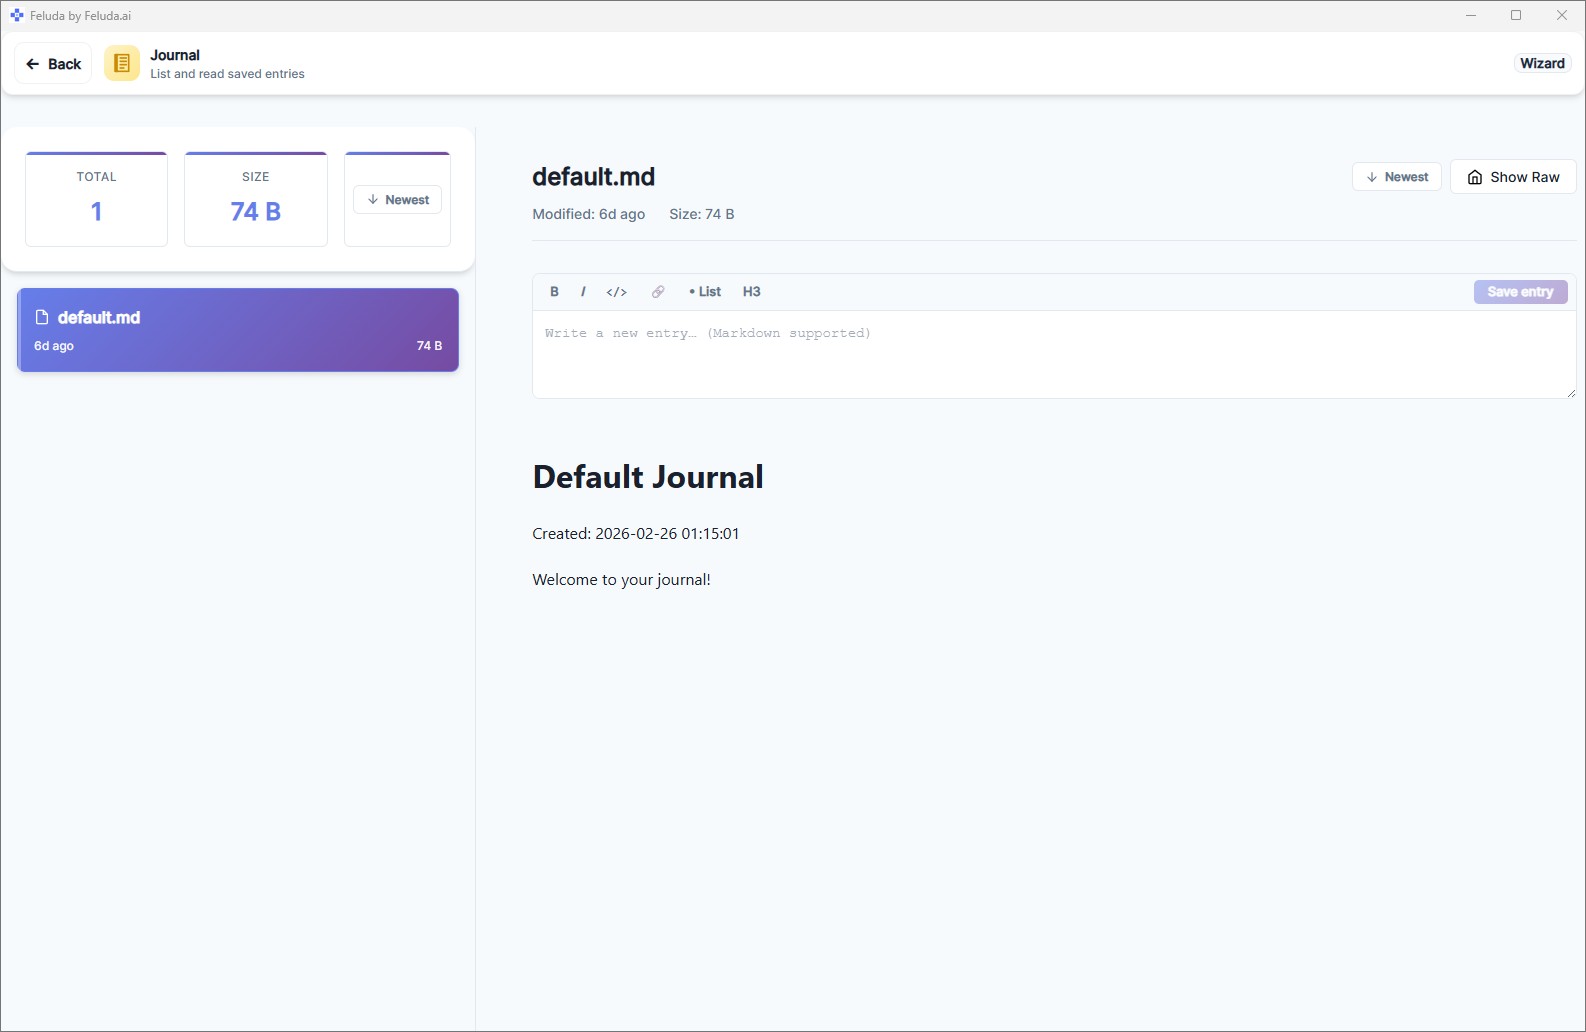
The Journal
The Journal is a built-in interface and tool that ships with every Feluda Desktop App. When you enable the Journal tool and provide it to an LLM, the AI can keep an offline journal — writing entries during conversations and flow executions.
- Browse and read entries written by AI agents
- Add your own notes with the built-in Markdown editor
- Sort entries by date (newest or oldest first)
- Monitor a specific journal in real time with the Journal Monitor
Set up a daily news-summary flow that writes its findings to the Journal. Each morning, open the Journal to read the AI-generated summary alongside your own notes.
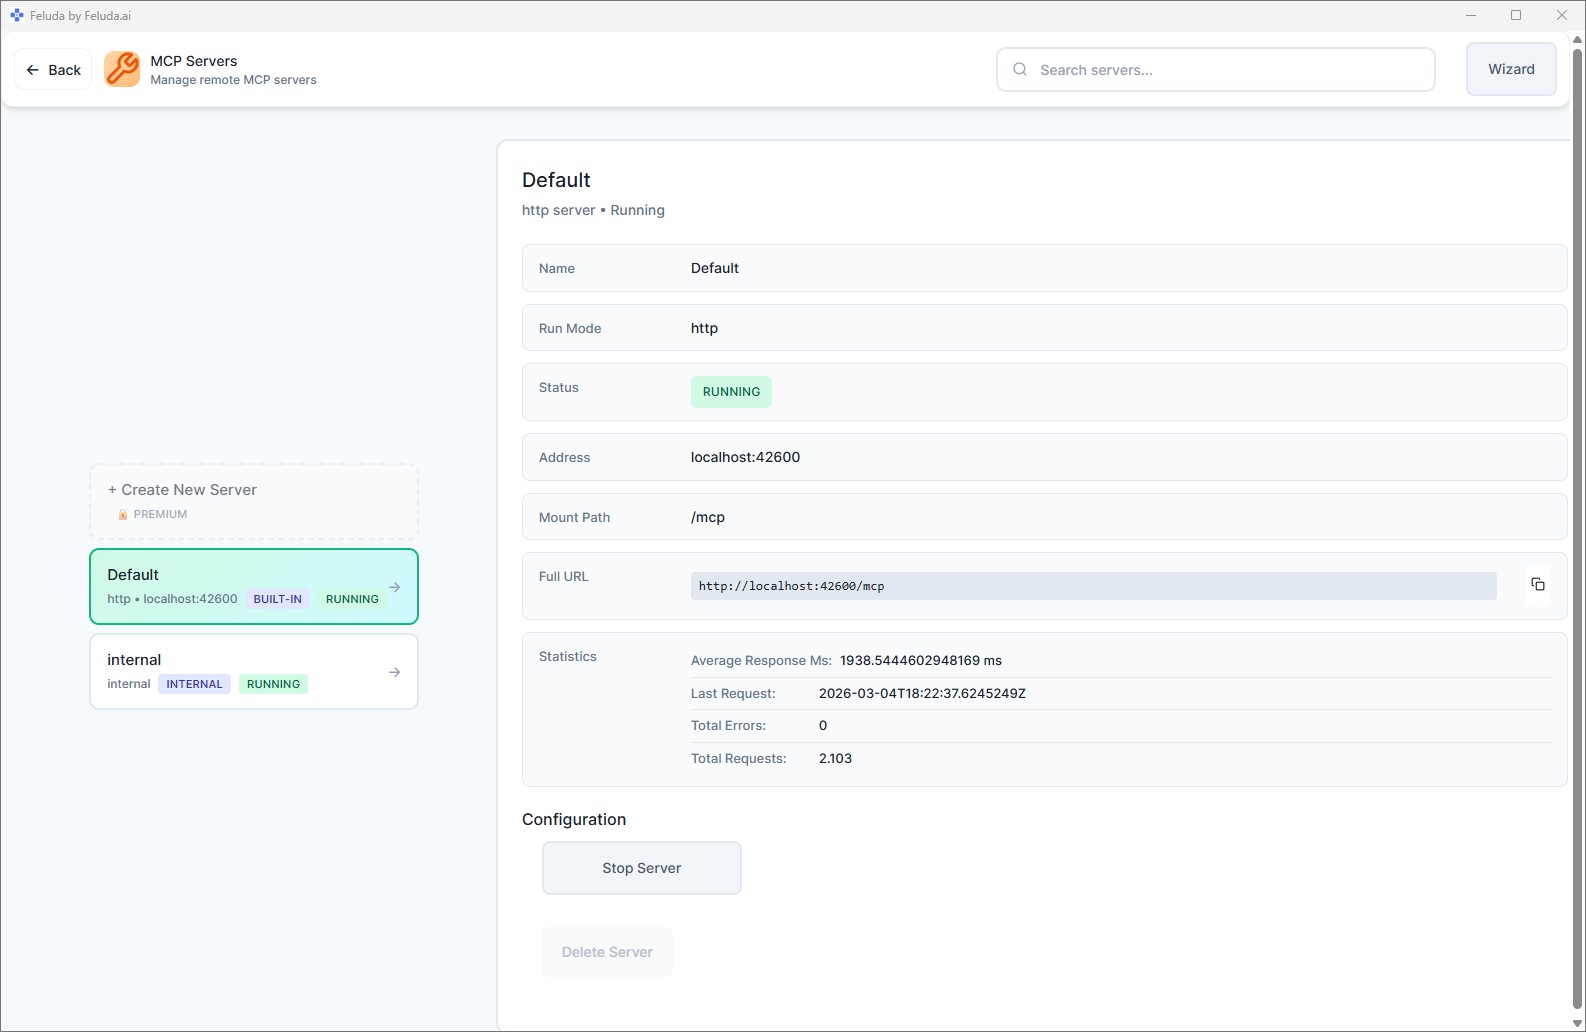
MCP Servers
Model Context Protocol (MCP) servers extend Feluda with additional tools beyond what Genes provide. Feluda includes a built-in default MCP server, and you can connect external ones.
Open MCP Servers
Go to MCP Servers from the Dashboard sidebar.
Add a server
Specify the server's connection details — endpoint URL, authentication, and name.
Use the new tools
The server's tools appear alongside your Gene tools in the Workbench and Studio — ready to use in conversations and flows.
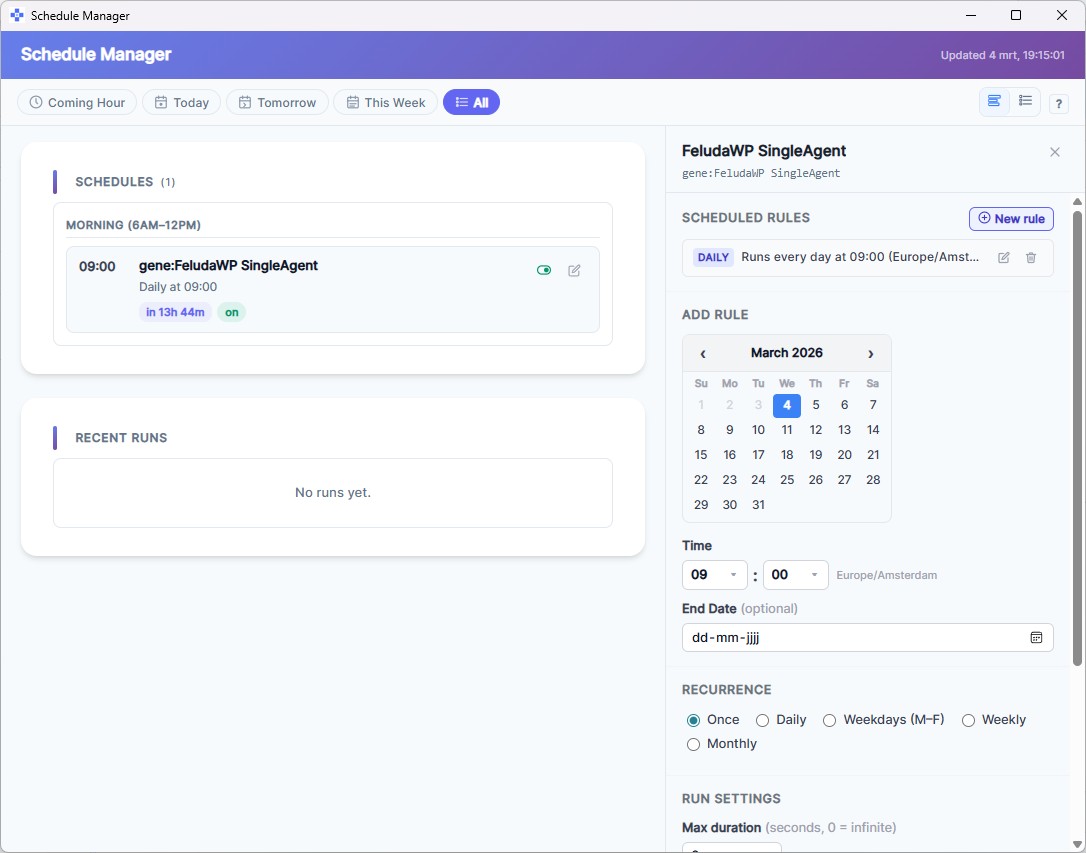
Schedule Manager
Automate your workflows by scheduling them to run at regular intervals. Available in paid plans.
Open the Schedule Manager
Navigate to it from the Dashboard or from the RunFlows page.
Create a schedule
Choose a flow and set its frequency: once, daily, weekdays, weekly, or monthly.
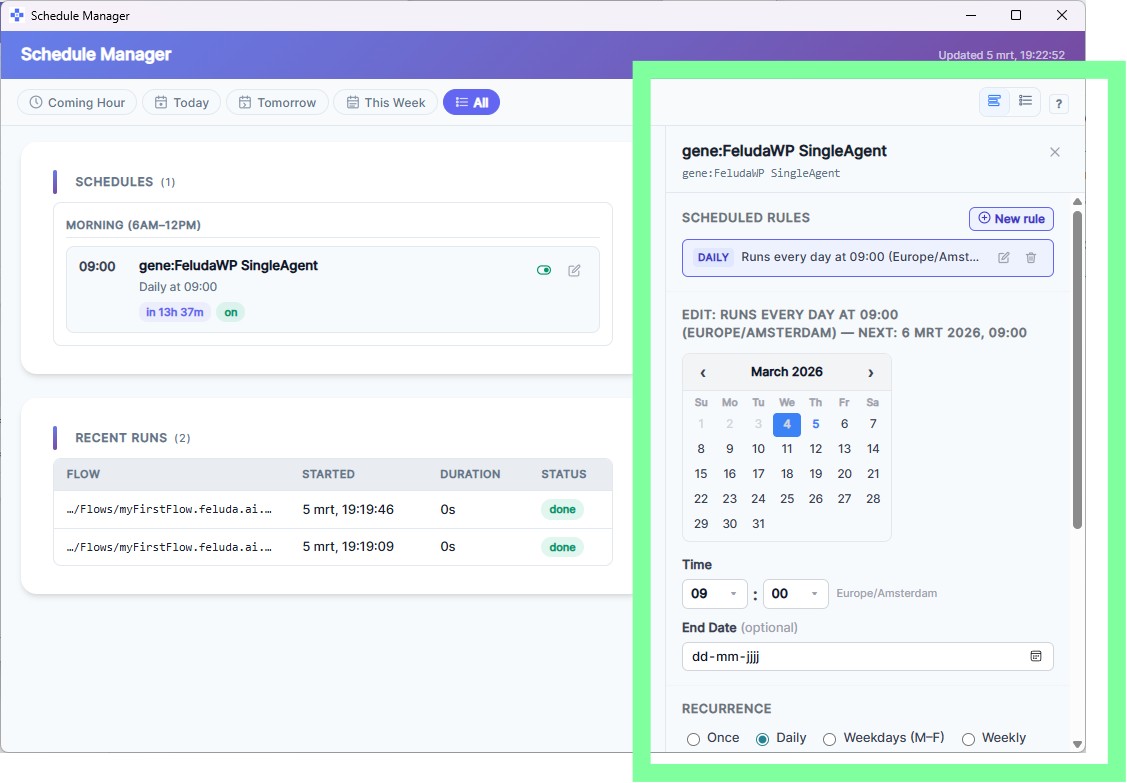
Monitor and manage
View upcoming runs, recent history, and conflict warnings. Pause or resume schedules at any time.
Debugging Flows
When something does not work as expected, Feluda gives you full visibility into what happened:
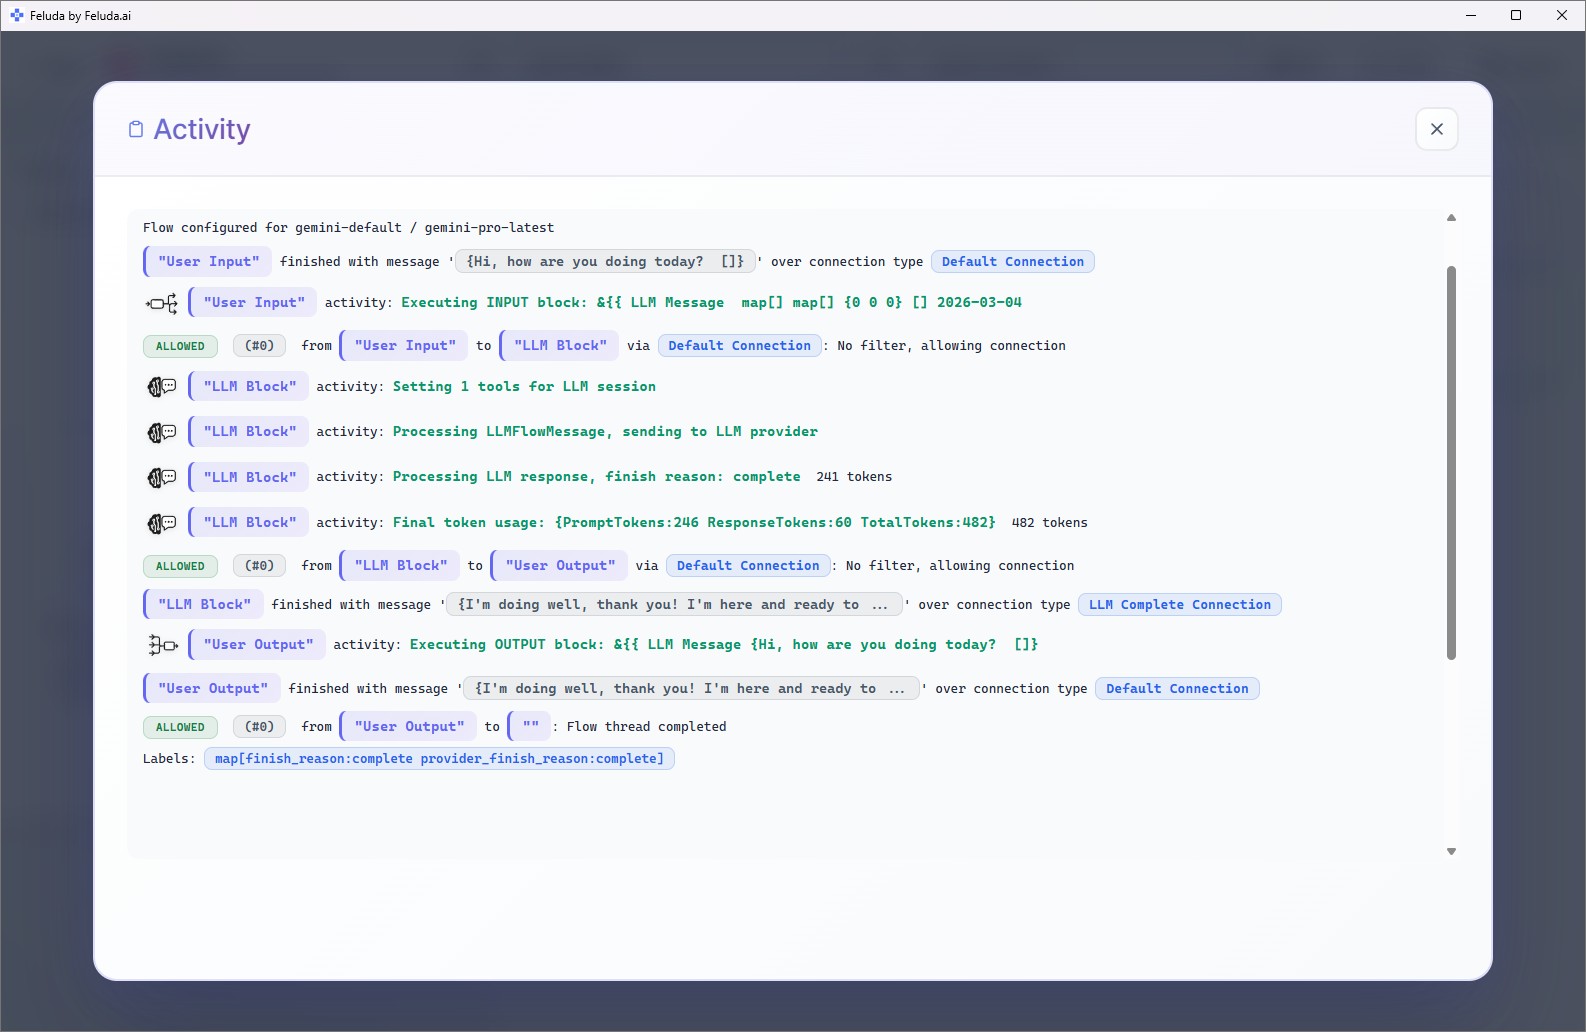
- Activity log — The Workbench Activity drawer and RunFlows output show every tool call, input data, output data, and error messages.
- Emit blocks — Add Emit blocks in Studio to output intermediate results at any point in a flow.
- Flow Permissions — If a tool fails with a permission error, check the flow's Permissions panel (URL, IP, path, and port allowlists/denylists).
Start simple, then iterate. Build a basic flow first — once it works, add complexity. Use the Workbench for experimentation before building complex flows. Leverage Gene flows as templates — open them in Studio, learn from the design, then customize.
Advanced Flow Blocks
You have used Input, LLM, and Output. Here are more blocks to explore in Studio:
LLM Label
Classify text into categories and route the flow differently. Great for sorting emails, categorizing support tickets, or building decision trees.
LLM Extract
Pull structured data from unstructured text — names, dates, prices, or any fields from documents.
Expression
Run logic and transform data without AI. Useful for data cleaning, filtering, and conditional branching.
Generate Image
Create images using AI image-generation models directly inside your flows.
Emit
Output intermediate results at any point — useful for debugging or progress updates in long flows.
Frequently Asked Questions
Can Feluda run AI workflows on a schedule?
Yes. The Schedule Manager lets you schedule flows to run once, daily, on weekdays, weekly, or monthly. You can pause, resume, and monitor scheduled runs. Note: scheduling is available in paid plans.
What is an MCP server in Feluda?
MCP (Model Context Protocol) servers extend Feluda with additional tools. Feluda includes a built-in MCP server, and you can connect external ones for custom APIs, internal services, or community tool servers.
How do I debug a failing AI workflow?
Use the Activity log in the Workbench or the RunFlows output panel. They show every tool call, input/output data, and error messages. Add Emit blocks in Studio for intermediate output.
What is the Journal in Feluda?
The Journal is a built-in interface and tool that ships with every Feluda Desktop App. When enabled and provided to an LLM, it lets the AI keep an offline journal. You can browse entries, add your own notes, sort by date, and monitor journals in real time.
You're Ready 🎉
You have completed the Quick Start Guide. Configure providers, build flows, enable tools, and let AI handle the heavy lifting — all from your desktop with full privacy and security.